What is Google Optimize?
Today’s popular Google Optimize isn’t exactly new, as it’s Google’s replacement for an earlier experimentation tool within Google Analytics which is now made an independent, full-fledged experimentation tool. What is nice about this tool is that it relies greatly on Google Analytics data and it can integrate results and inputs with Analytics.
Google Optimize has a free version with basic features; it also has a paid version which is named “Optimize 360” that has more capabilities. However, the free version of Optimize can work well for many basic experiments.
Google Optimize includes Analytics, Tag Manager, Surveys and Data Studio which are all free and work together to make all of their data available in one place which is one of its unique features.
Basic features
Though the free version of Google Optimize is a basic tool, it is enough to conduct a viable testing program with the most common types of tests, which includes A/B, multivariate and redirect testing.
It has a simple setup. Moreover, Google Optimize features an integrated WYSIWYG web page editor. It also has a code editor which is presented in the form of a Chrome add-on which makes creating variations easy. Just like any other Google tools, if something goes wrong, there is a diagnostics tool which helps you identify what went wrong with the installation.
The most impressive feature of Optimize is its ability to integrate with other Google tools. Integrating all these tools allows you to have your quantitative reports, experiments, results tracking and reporting in one tool. This is in addition to a separate product being rolled out by Google, Data Studio, which allows visual enhancements to Analytics and Optimize reports by building custom dashboards and reports.
Google Optimize uses the
Bayesian statistics to conduct experiments. This is its distinct characteristic as other major competitors offer a choice of using between frequentist and Bayesian methods.
What is great about this Bayesian statistics is that it offer more accurate results. That being said, Optimize is the first tool to use Bayesian statistics exclusively. As with regards to the interpretation of results, it will require getting used to it.
As there are two versions of Google Optimize, you should know that they have slight differences.The free version allows only three concurrent experiments while the paid version offers unlimited.
There is still another difference, but this may not matter a lot – the free version limits variations on multivariate tests to 16. This limitation might only be because Google Optimize is still developing. What is important is the fact that Google Optimize is a great tool for beginners to start their testing programs.
Understand Reporting
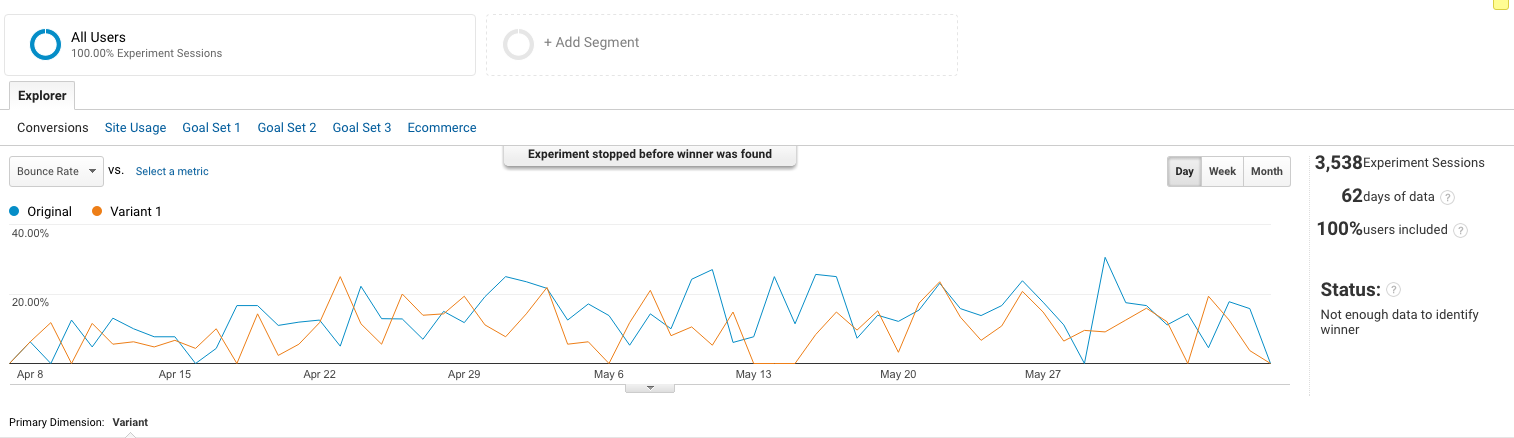
Google Optimize offers an easy way to understand reporting interface that shows you how each variation is performing against the original, and how it is contributing to your Google Analytics goal completions. See the sample below:
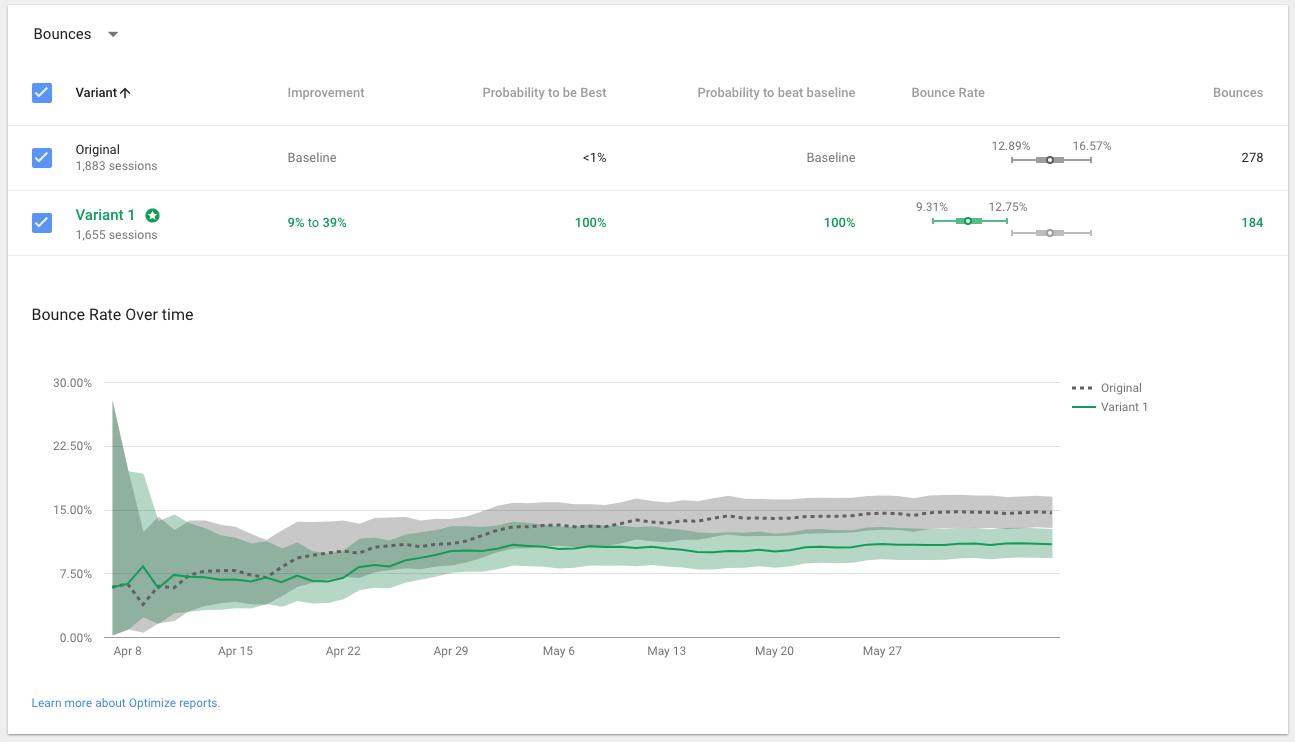
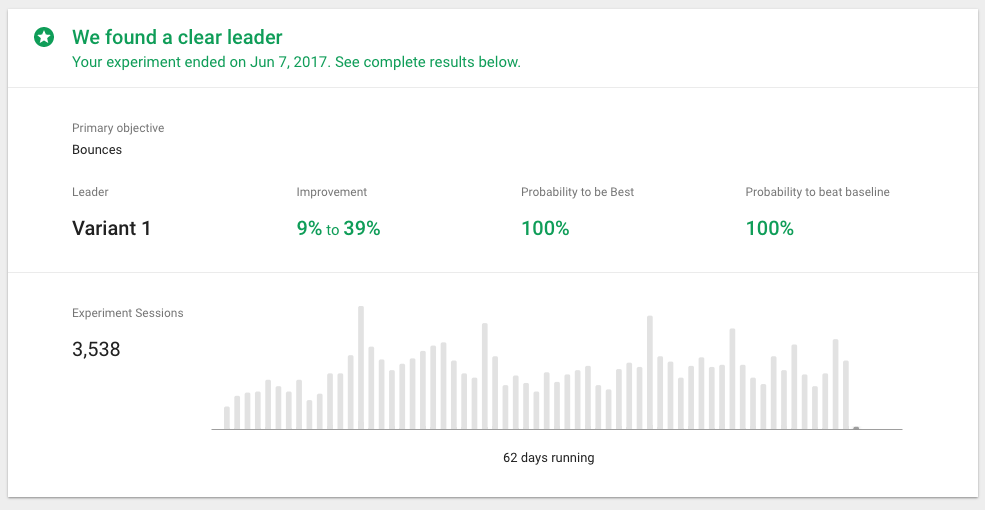 The results above can tell whether or not increasing text size on a page reduced the bounce rate on a sales page.
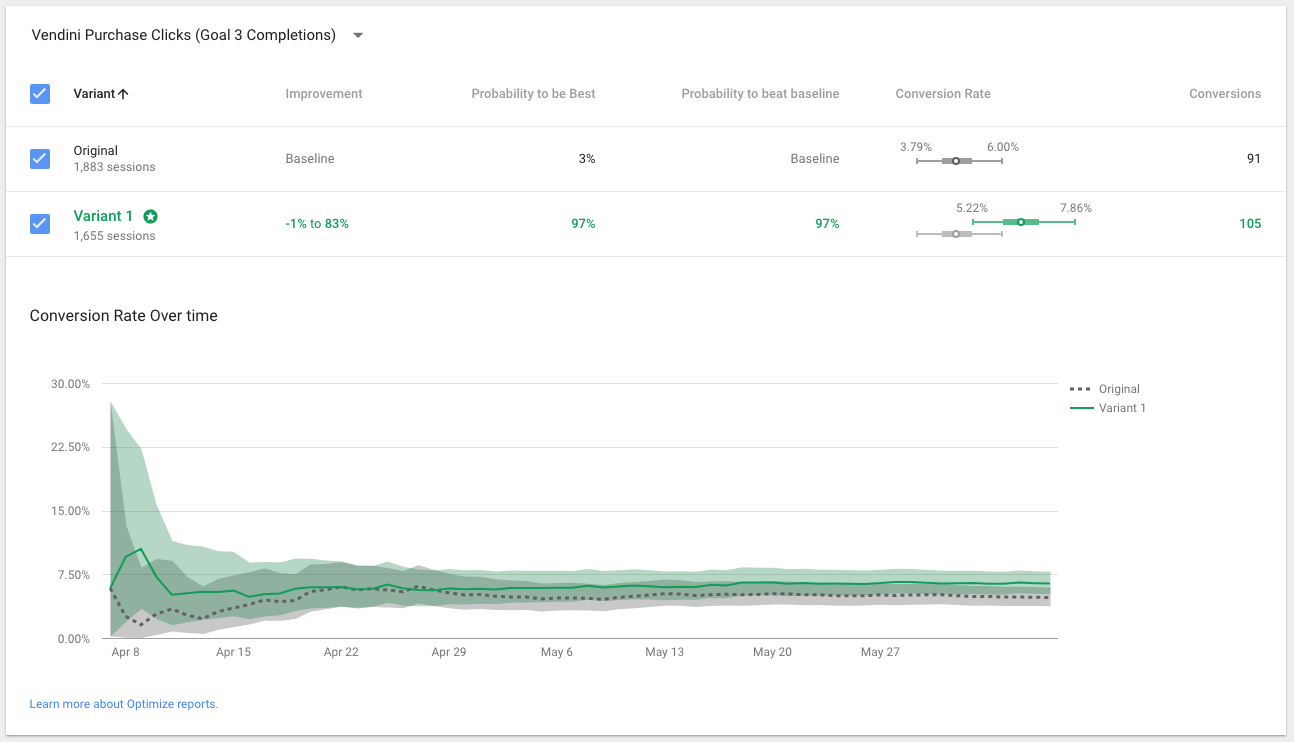
Google Optimize can also test many items at once, in our example, we tested the effect of increased text size on bounce rate as well as transactions.
The image below shows the specific information relative to our variable, Vendini Purchase Clicks. Google Optimize gives you the total conversions, the probability of being the best, and the conversion rate range. Our Variant 1 had a median conversion rate of 6.46% compared to the original 4.82%. You can see this by hovering over the conversion rate bars.
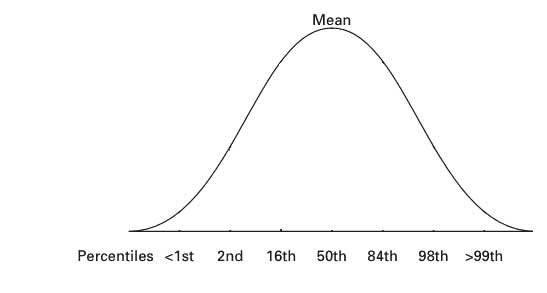
Google Optimize provides you with several different figures.
- Middle 95th – Range of scores between the 5th percentile and the 95th percentile.
- Middle 50th – Range of scores between the 25th percentile and the 75th percentile for a given group
- Median – The midpoint of a frequency distribution of observed values or quantities.
Here is an illustration of the percentiles.
Google Optimize has a unique way of collecting data and making it accessible. Google Optimize does not just collect data, unlike other A/B testing tools. Instead, it fetches data from the Google Analytics view that is related to your experiment. This being said, the results of your experiment are subject to any filters used to that view. This is a great way to ensure that unwanted traffic, such as internal traffic or bots, does not pollute the results of your experiment and manipulate your results.
It is the connection of Google Optimize with GA that allows it to pass experiment results back into the Google Analytics reporting interface, making the data accessible via the Experiments report (navigate to Behavior > Experiments), that allows you to see the same data (experiment sessions, conversions, conversion rate, improvement over the original). Considering that this data comes from Google Analytics, you can also see additional metrics for each variant.
Its significance doesn’t end there as there’s more! It is good to know that in all the standard Google Analytics reports, you are allowed to use Experiment ID, Experiment Name, and variant as secondary dimensions. Plus, you can use the experiment dimensions to create a custom report.
Sources:
- https://www.e-nor.com/blog/google-optimize/google-announces-google-optimize-testing-for-all-for-free
- https://blog.kissmetrics.com/expert-google-analytics-reports/
- http://www.practicalecommerce.com/Google-Optimize-Setting-Up-Experiments
- http://online-behavior.com/testing/google-optimize