What is Facebook Analytics?
As an owner of a fast-paced digital marketing agency, I understand how valuable time is. That’s why this guide will cut through the fluff and straight to actionable and useful elements of Facebook Analytics.
Facebook Analytics was originally meant to be an analytics platform for mobile apps, but it has grown to be a complete analytics package, much like Google Analytics.
IMPORTANT: Facebook Analytics is not a substitute for Google Analytics.
Both Google Analytics and Facebook Analytics offer valuable insights. Cerebro recommends you have both installed on your website to gather as much data as possible.
But first, how to get to Facebook Analytics? Visit this link and open up your preferred account.
https://www.facebook.com/analytics/?nav_source=mega_menu
Section 1: Pixel vs Page
Pixel vs Page
One of the first things you might notice when you search for a property is that both the pixel and page appear. This is normal. Facebook Analytics provides you with insights into your Facebook page as well as your pixel.
You might be wondering why there is a difference. A Facebook page is only about your business, while a Facebook pixel can be on your main website, a sub-domain, or even a third-party booking system.
A pixel can keep track of your most valuable actions across many websites, not just your own. Here is a quick example,
You are a hotel and use a third-party booking system. A user hits your website and the Facebook pixel fires. That visitor clicks to book a room and enters your booking system, which is at yourbusiness.bookaroom.com. You’ve installed your Facebook pixel on this other domain, it fires to capture the rest of your customers booking process.
Long story short, a Facebook Pixel isn’t limited to just your domain. It can be used across all of your web properties (and mobile apps).
For this tutorial, let’s focus on pixel since that is where we will see our revenue, funnels, and more.
I sure hope you named your pixel, if not, go and do that first since your Analytics dashboard can get cluttered real fast.
2. Dashboard
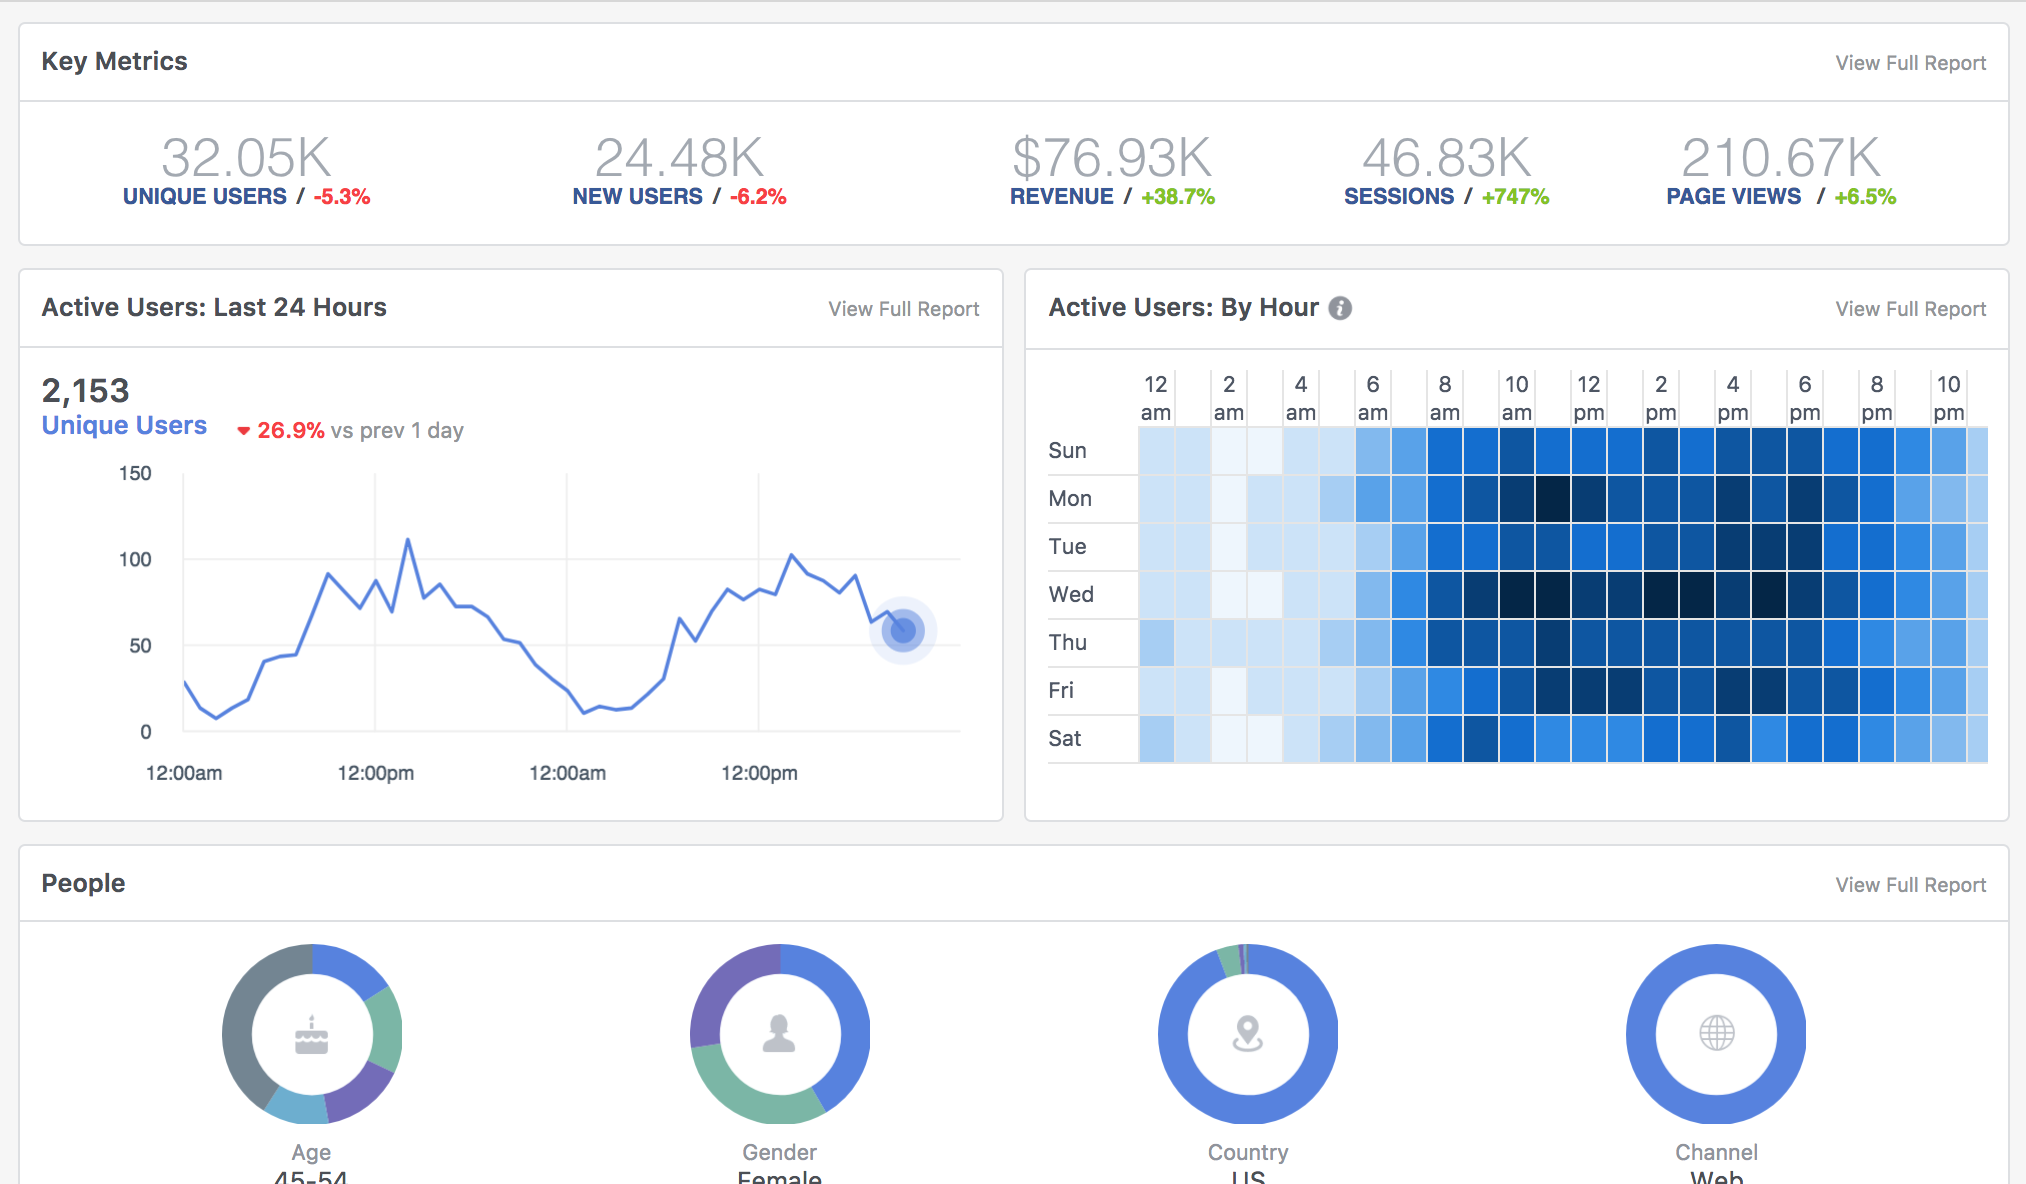
The first thing you will see is your dashboard with some Key Performance Indicators (KPI’s).
Facebook Analytics works much like Google Analytics. A piece of code (JavaScript) fires when an event happens (pageview, button click, purchase, etc) and reports that back to Facebook.
I will do my best to keep up with definitions here but if I miss one, please leave me a comment and I will get that fixed. Some of these definitions will look familiar since Google Analytics uses similar terminology.
Quick Definition Recap:
- Unique Users – an actual user or person.
- New User – Facebook can identify if it is someone’s first visit to your site (keep in mind this isn’t 100% perfect, people can clear cookies and browsing history)
- Revenue –

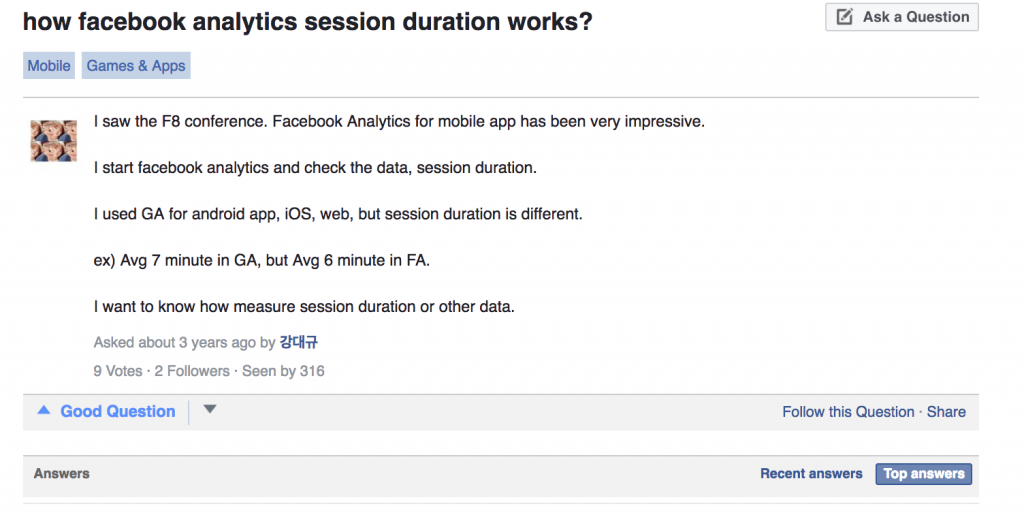
- Sessions – A unique user can have many sessions, a session is a specific duration of time spent on your website. How long is a session? Good question, this person’s been waiting 3 years to get that answer.
- Page views – the amount of pages viewed by a user on your site, (i.e. home page, about us page, and product page would be 3 page views.)
- Active users – these are users that were on your website recently
The dashboard has all sorts of useful information. Scroll down and you will get things that might look familiar, traffic sources, top referrers, etc. Many of the things we know and love in Google Analytics.
Each section of Facebook Analytics has its own VIEW FULL REPORT link when clicked, it dives deep into that specific data set.
3. Revenue Report
I plan to dive deep into every section but for now, let’s focus on Revenue. Why?

Disclaimer: This is a real account, so numbers have been changed and figures may not add up
Revenue reporting in Facebook might not seem like a big deal, sure we have this in Google Analytics, but there is something that sets Facebook apart.
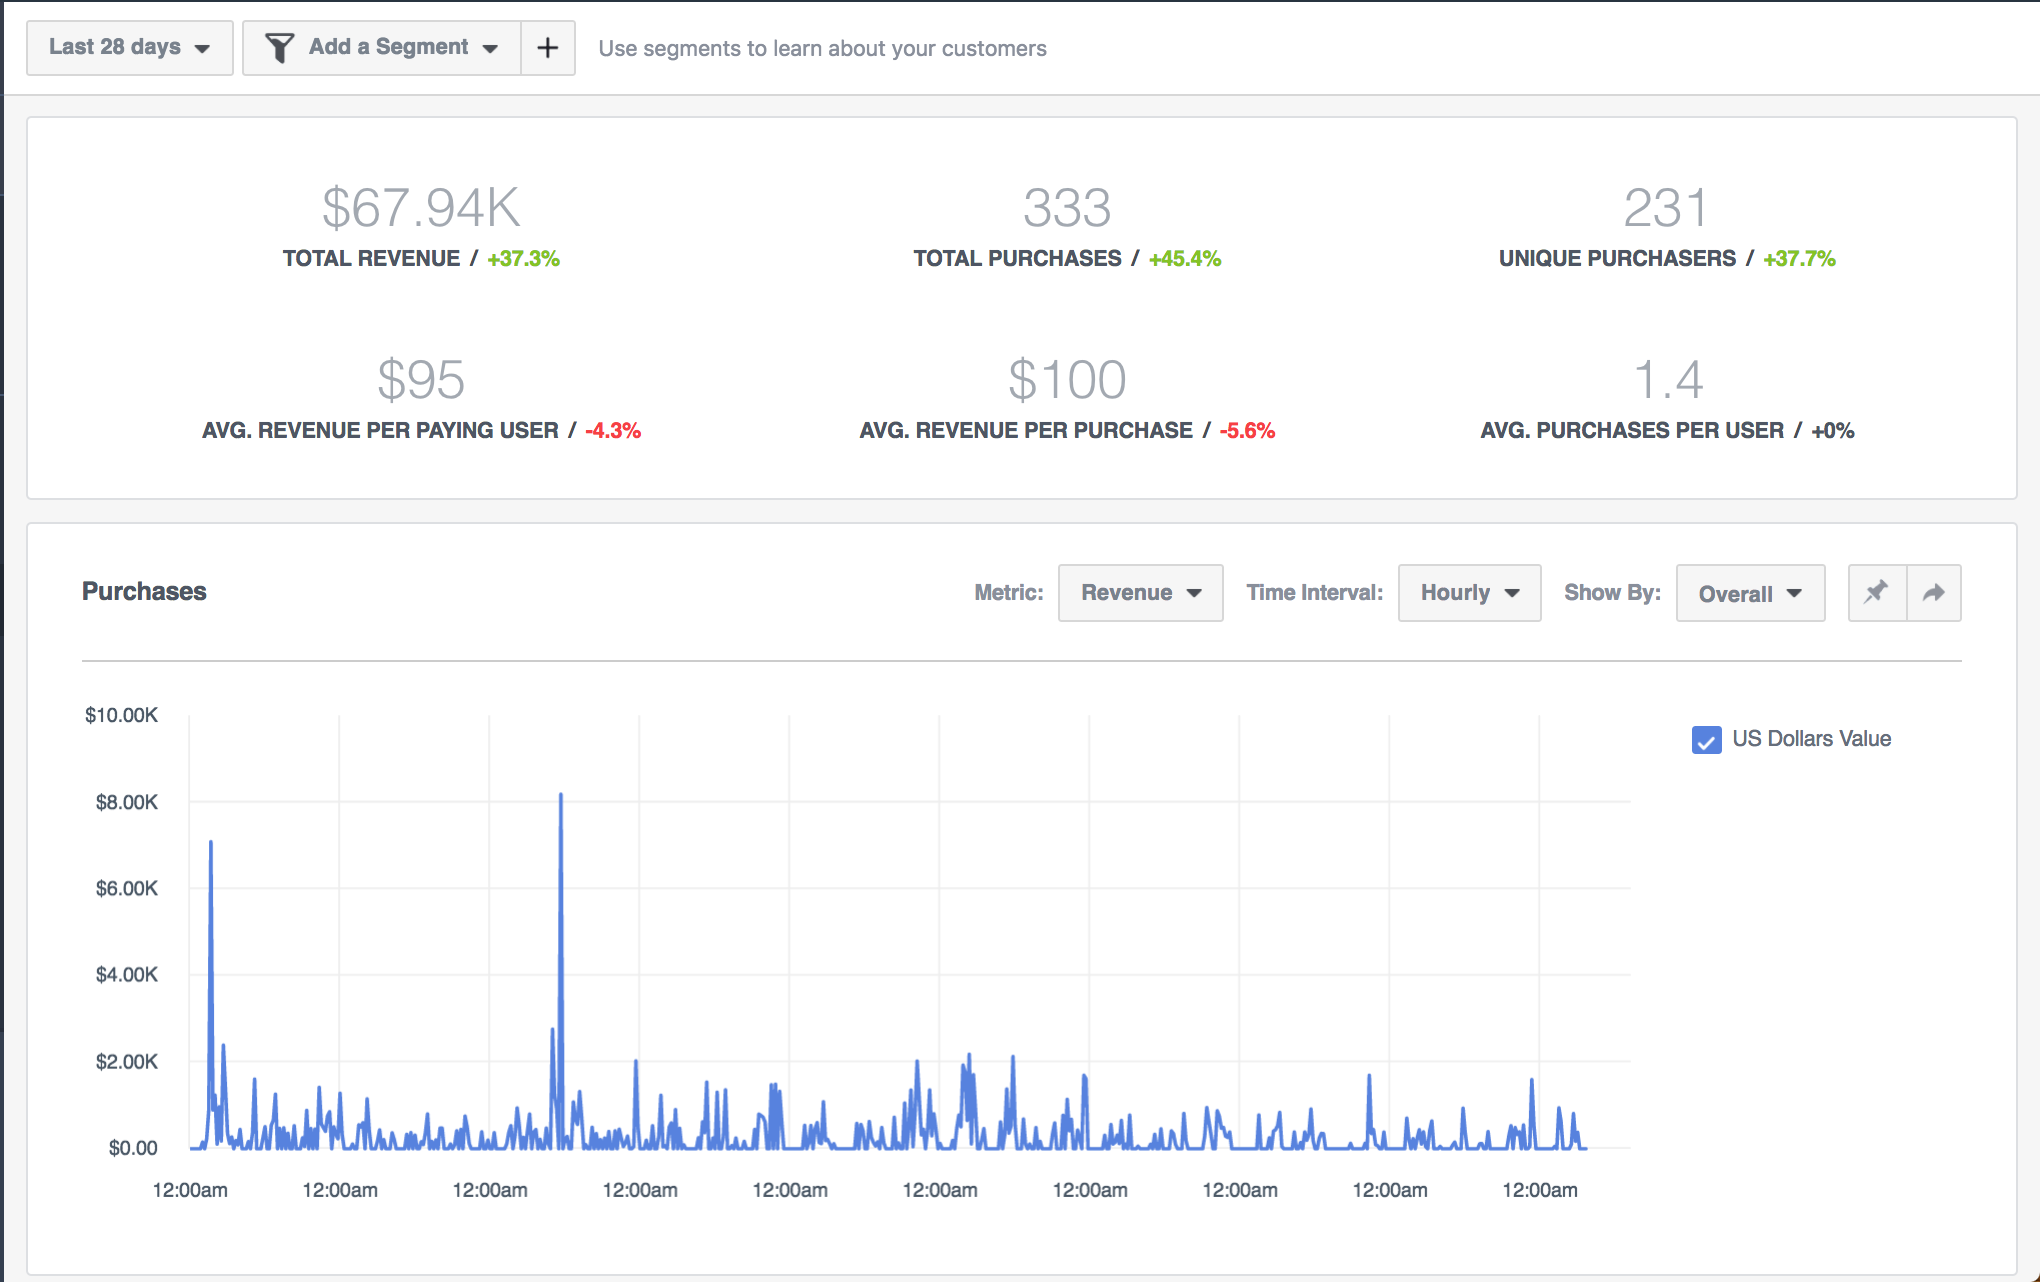
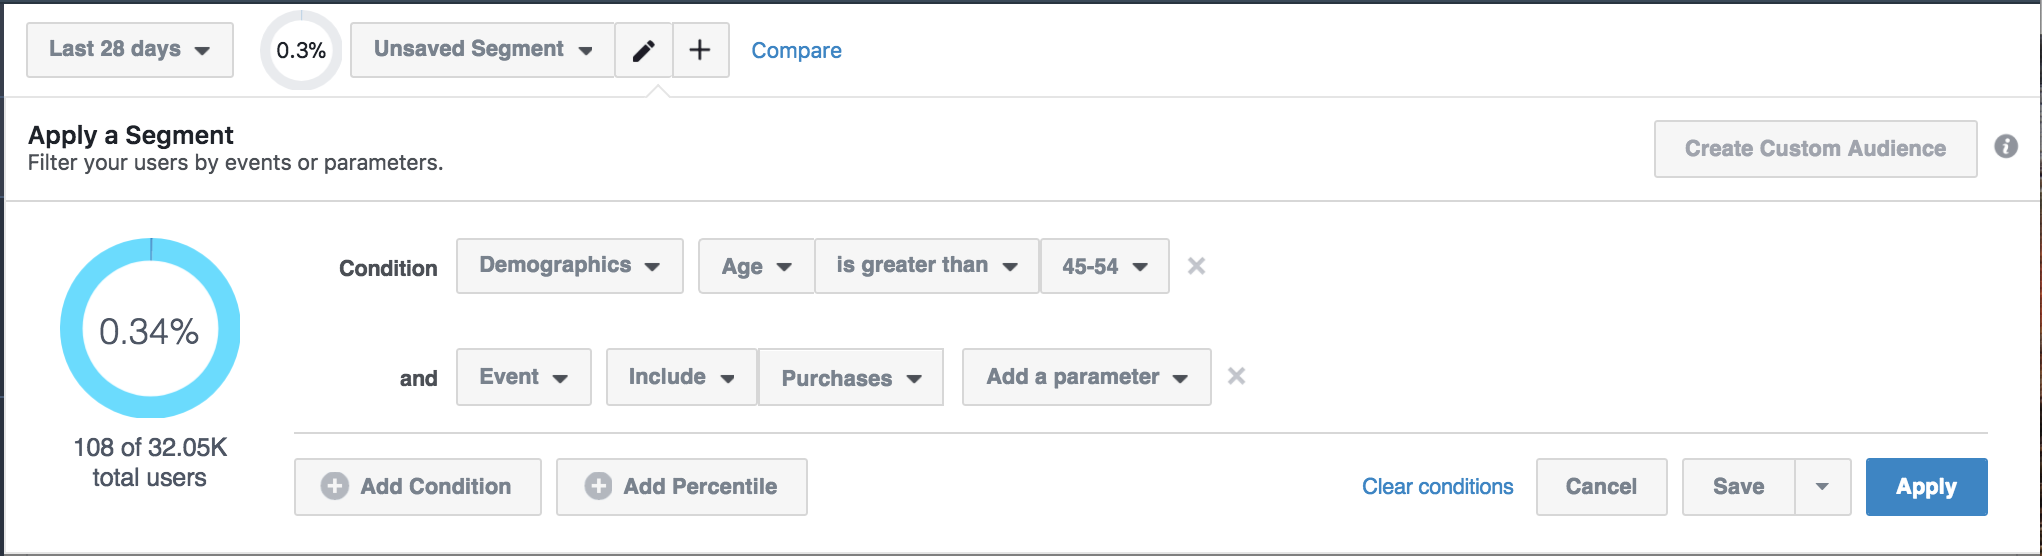
On the top near the date, you have an
add a segment drop down. Click that and let’s get rolling.
Here you can build a segment of people based on their demographics, a specific event (i.e. a page visited, etc), device, and more.
This is extremely powerful since you can now begin to understand purchase behavior along with demographics, device, and more.
I built a segment of people that are over the age of 45-54 (i.e. 55) and made a purchase. The Revenue Report will update to display the figures for your segment. Here you can start to see actionable data.
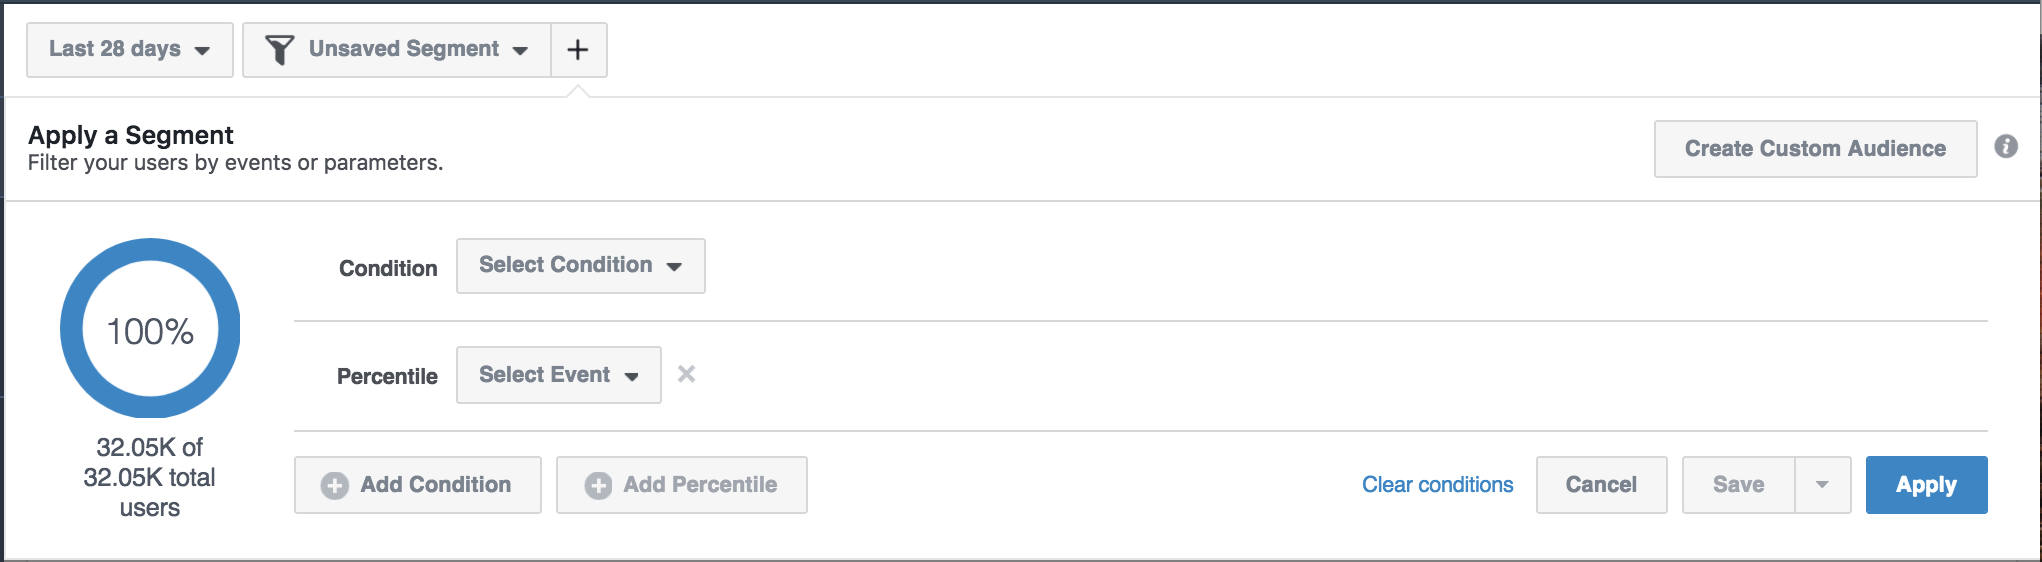
For example, here is my age/gender graph to show purchases.
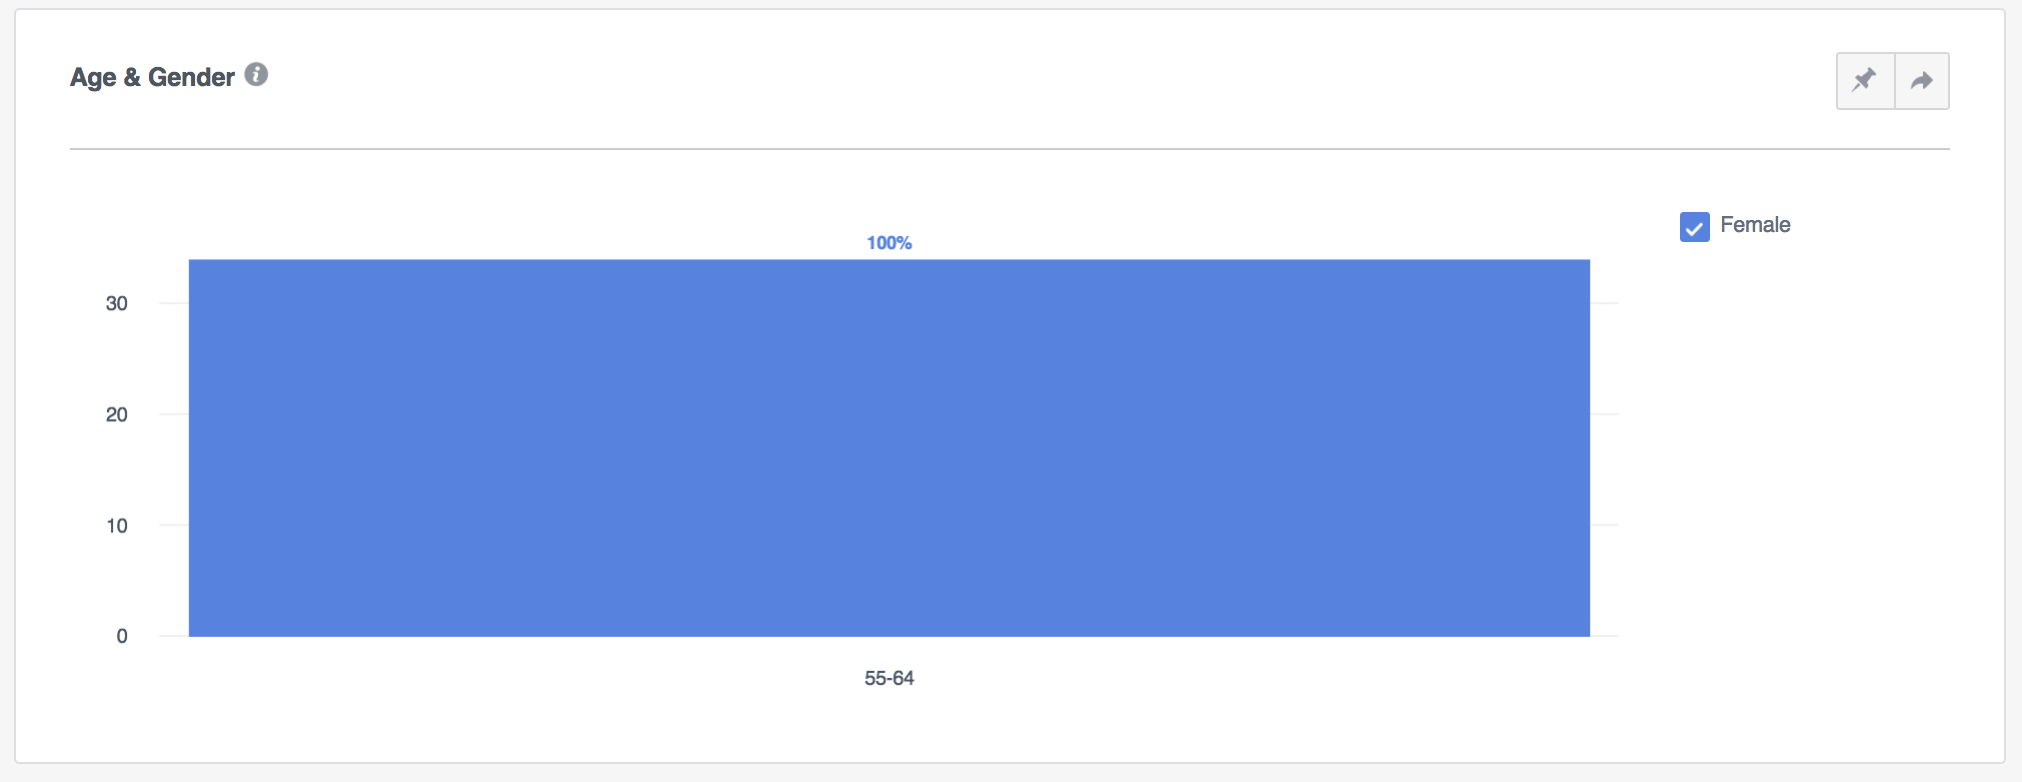
100% of my purchases for people over the age of 55 are Female. That is definitely valuable data.
You can start to build more segments to begin comparing data. There is even a compare feature next to the add a segment drop down. Create your segments and start comparing. You can begin by seeing if there are any differences in purchase behavior between men and women or by age groups.
You can even compound demographics and break downs. You can build a segment of
- people who made a purchase
- are under the age of 55
- are female
You’re only limited by your creativity. See what other valuable information you can unearth by segmenting your purchase events.
3. Funnels
A marketing funnel is one of the most useful things you can create as a marketer. A marketing funnel is a system that helps track the stages consumers travel through to eventually make a valuable action on your website. This doesn’t always end in a purchase. Valuable actions can be anything from visiting a key page to filling out a form.
Why are funnels important? They show you your weaknesses.
Funnels can be as simple as three pages,
Home Page > About Us Page > Contact Form or complex with several smaller funnels creating one massive funnel.
To learn more about funnels, check out Kissmetrics amazing
article on marketing funnels for a great
recipe for funnel cakes, here is one that won’t disappoint.
Facebook Analytics offers the ability to create your own funnels. Much like Google Analytics, you specify the steps of the funnel and let Facebook do the rest.
From the left side menu, select
Funnels.
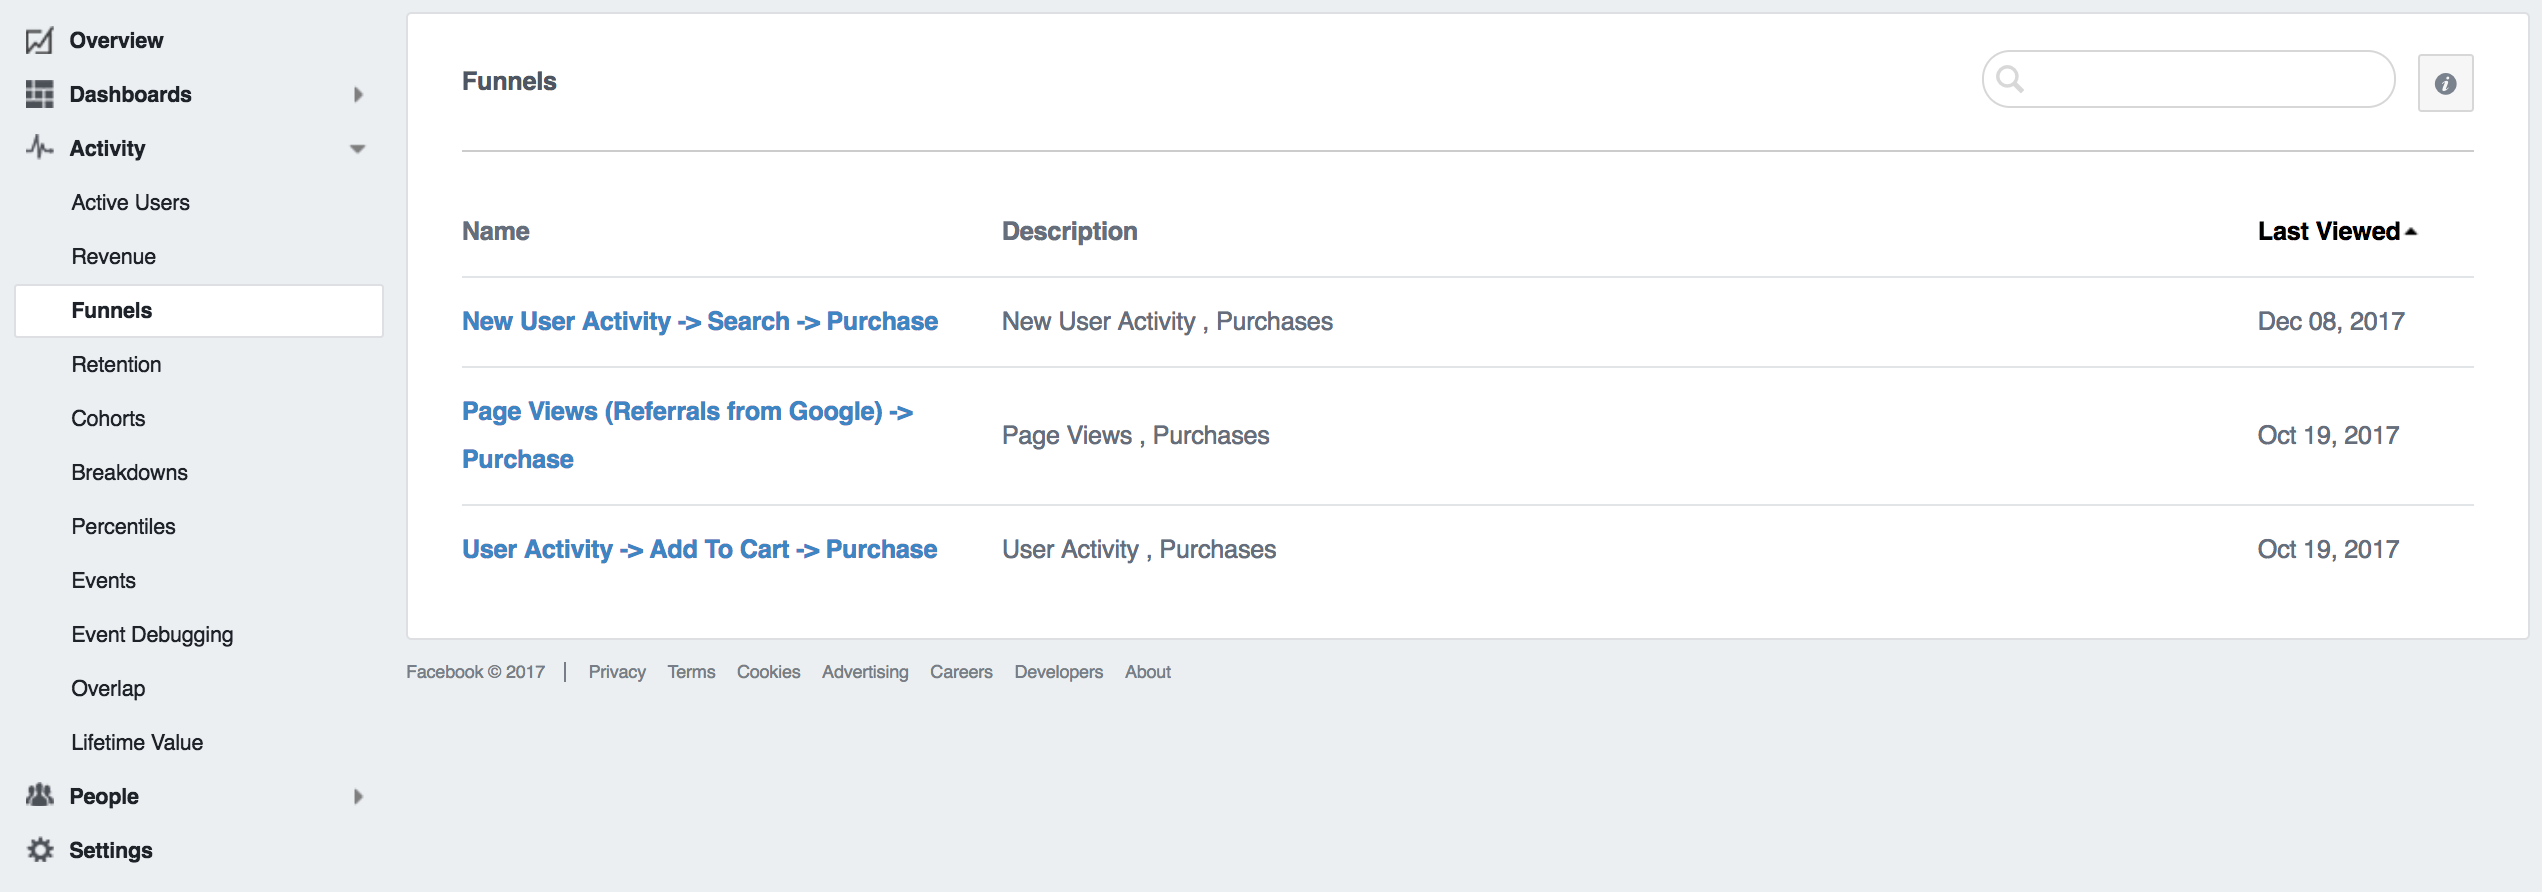
Facebook offers some basic funnels. These three funnels are all focused on a purchase goal. If you did nothing but utilize these 3 funnels, you’d still gain valuable insights and improve your marketing.
I am going to assume you have a
New User Activity > Search > Purchase funnel.
Once you open a funnel, you are presented with detailed information on that path. Remember those segments we created previously? The great news is you can use them here.
You can see the conversion funnel, not just for all visitors, but specific segments of website visitors. You can start to understand how different segments of people interact with your website on their way to making a purchase.
Does your conversion rate drop for people over 65+, increase your font a few points. These small changes can make a huge difference.
The fastest way to increase revenue isn’t to find more customers, it’s to convert your existing customers at a higher rate.
Funnels help you achieve this.
Looking at your funnel, you will see your overall conversion rate and median completion time for all visitors (i.e. 100% of users).
Start to segment your users by age, gender, and device to see if any meaningful information comes out.
My overall conversion rate is 1.04%. I created a segment of users that are over the age of 55. Here are my results.
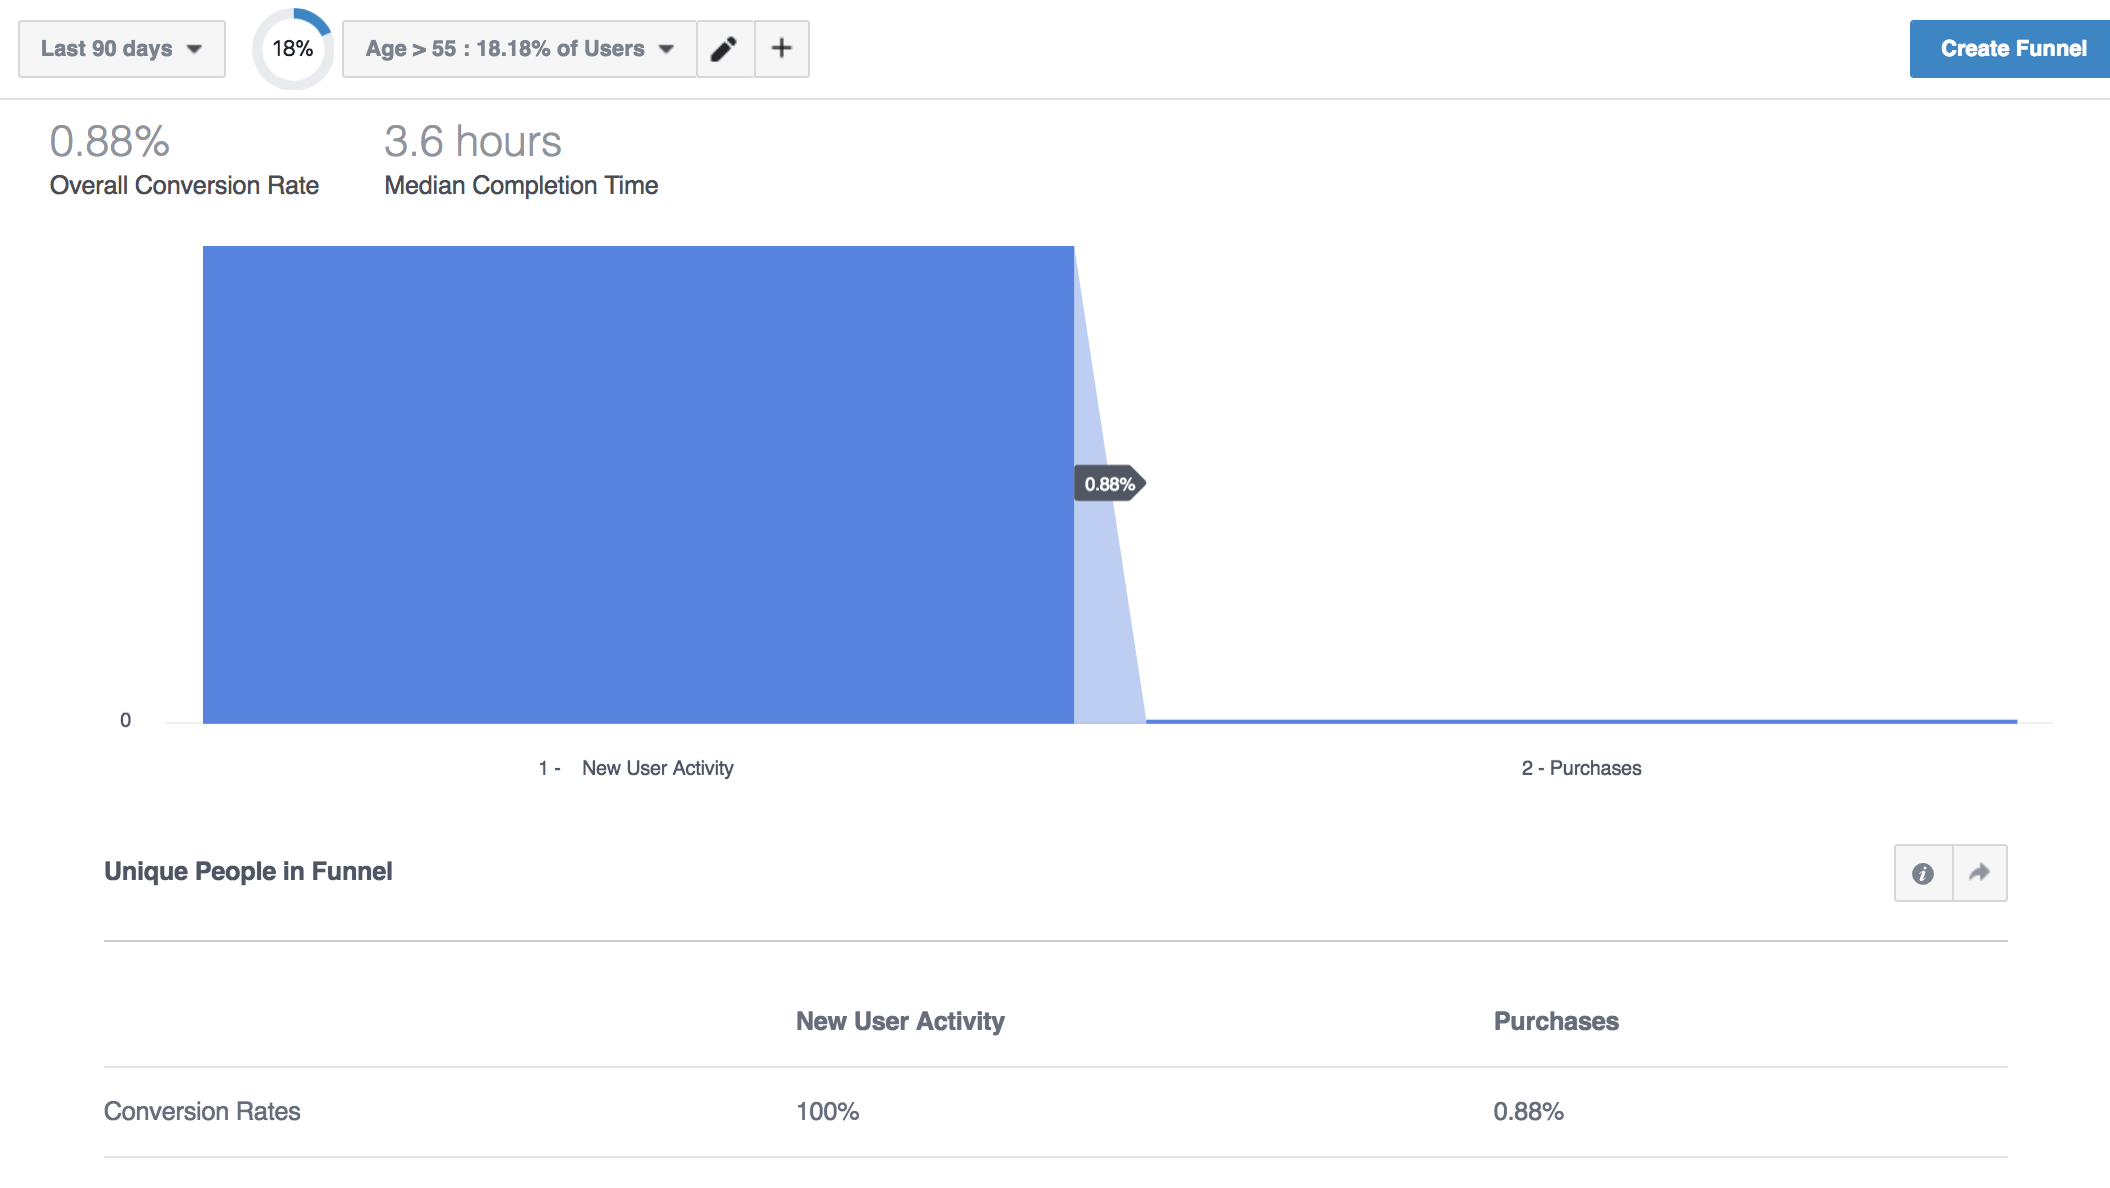
Nothing Earth-shattering here but I can still see that my conversion rate is lower among this age group.
Let’s segment by device and see if there is a difference between desktop and mobile conversion rates.
Here is desktop
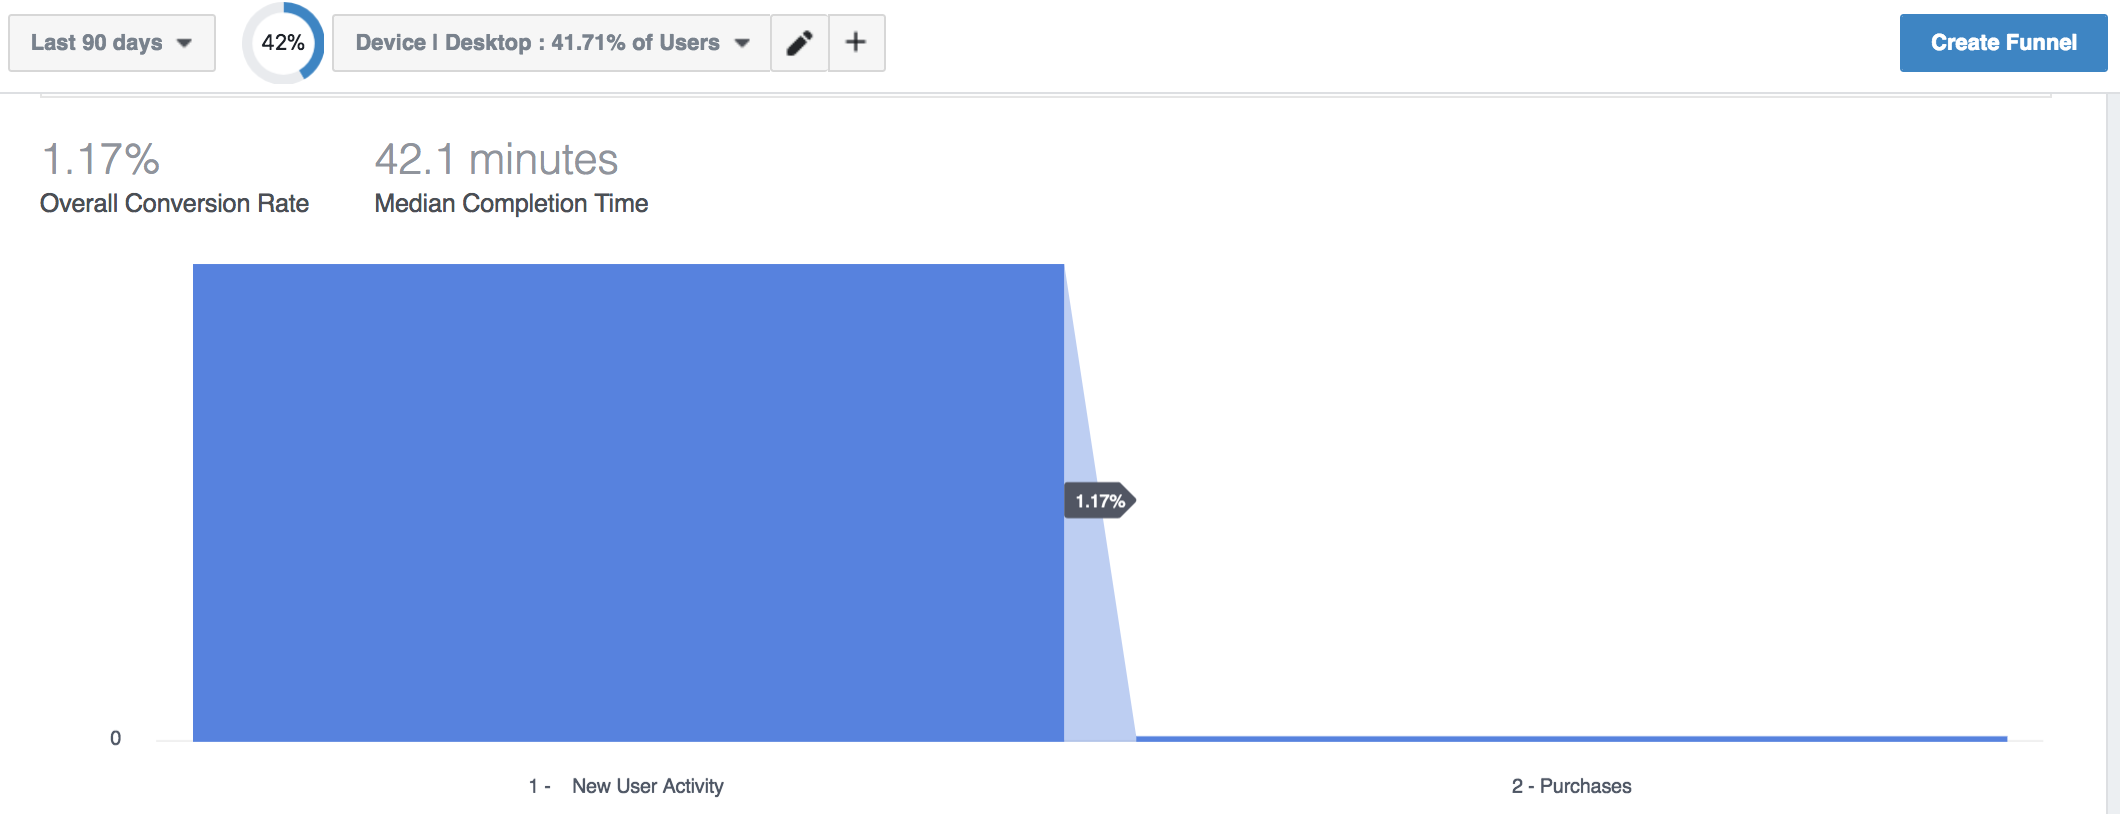
Much better conversion rate than the average (1.04%). Here is mobile + tablet.
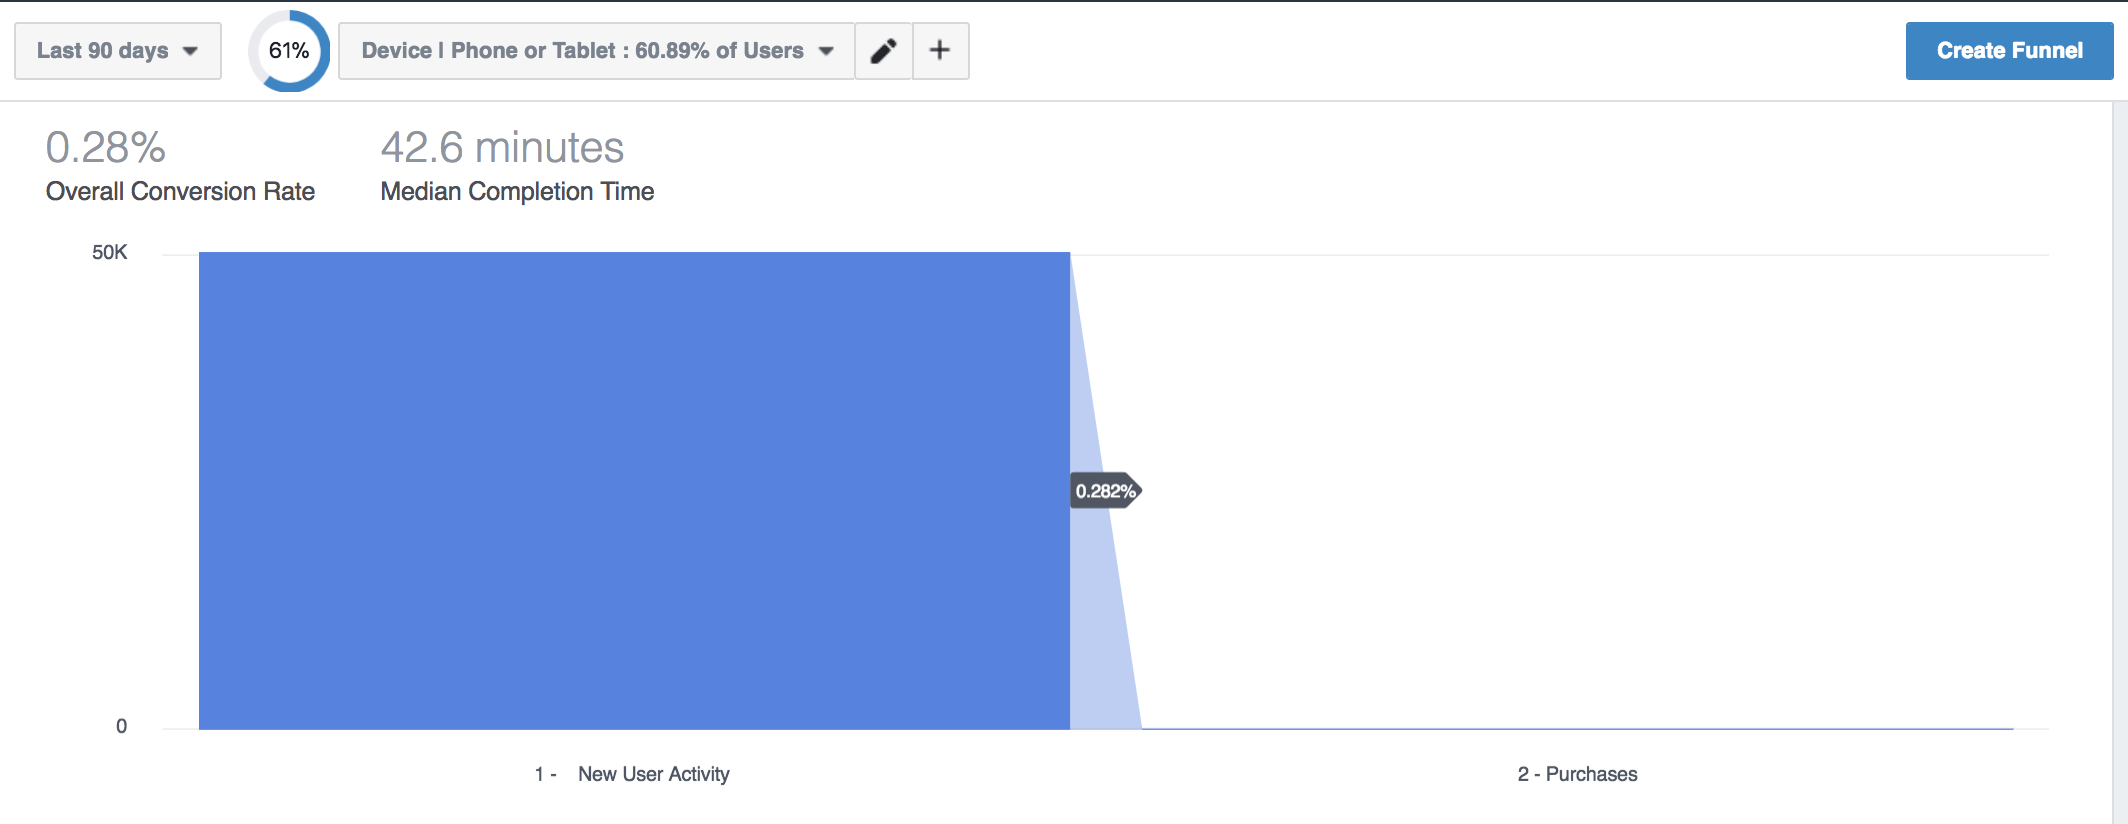
Big difference in conversion rate. If you look at the drop down or circle graph on the top of the graphs, you’ll see what percentage of users this segment represents. Desktop represents around 42% of the overall traffic to my website, while mobile represents nearly 61%.
Here is how important the conversion rate is.
It’s not shown on these images but desktop with the higher conversion rate represents $170,000 in revenue for this time period.
Mobile with nearly 20,000 more unique visitors, represents $43,000 in revenue. I need to step up my mobile game.
My poor conversion rate on mobile is impacting my revenue. If I were to improve my mobile conversion rate to a similar conversion rate to desktop, I would quadruple my revenue.
Now, these insights are also found in Google Analytics, but Facebook makes it easy to segment mobile users by gender, browser, age, and more.
You might get a “not enough info” message when trying to segment your audiences, unfortunately, to make these sorts of insights, you need a lot of sample data. Work with what you have to make the best decision possible.
Building New Funnels
Ready to build your own custom funnel? Sweet, let’s get started.
Building a funnel on Facebook is much different than Google Analytics. With Google, you select your trigger, whether that be a specific page visit or analytics event. With Facebook, you are choosing some predetermined fields.